Find the Connections Between Two Arbitrary Tasks in a CPM Schedule

BPC Logic Filter includes a little feature called Bounded Network (Target Task) Analysis.  The feature allows a user to identify all the logical path(s) connecting two arbitrary tasks (or connecting a group of tasks to a single task) in a Microsoft Project schedule.  I wrote a few (very dry) pages on it beginning around page 6 of the documentation: Introduction to BPC Logic Filter

I developed this feature out of my own need to efficiently communicate task dependencies to project stakeholders.  For example, a piece of major equipment is scheduled to arrive on-site (pre-assembled) on 1April, but it is not scheduled for handover until 1July.  For the eventual equipment owner, it is useful to have a graphical depiction of all the tasks – and only those tasks – leading from arrival to handover during the intervening three months (e.g. setting in place, hookups, mechanical inspection, systems testing, commissioning, acceptance testing, endurance testing, training, etc.)  While sometimes such tasks all share a common WBS code or custom field, it is rare that such codes correspond 100% with the logical chain(s) of required activities.  A logic-based filter provides a clearer picture.

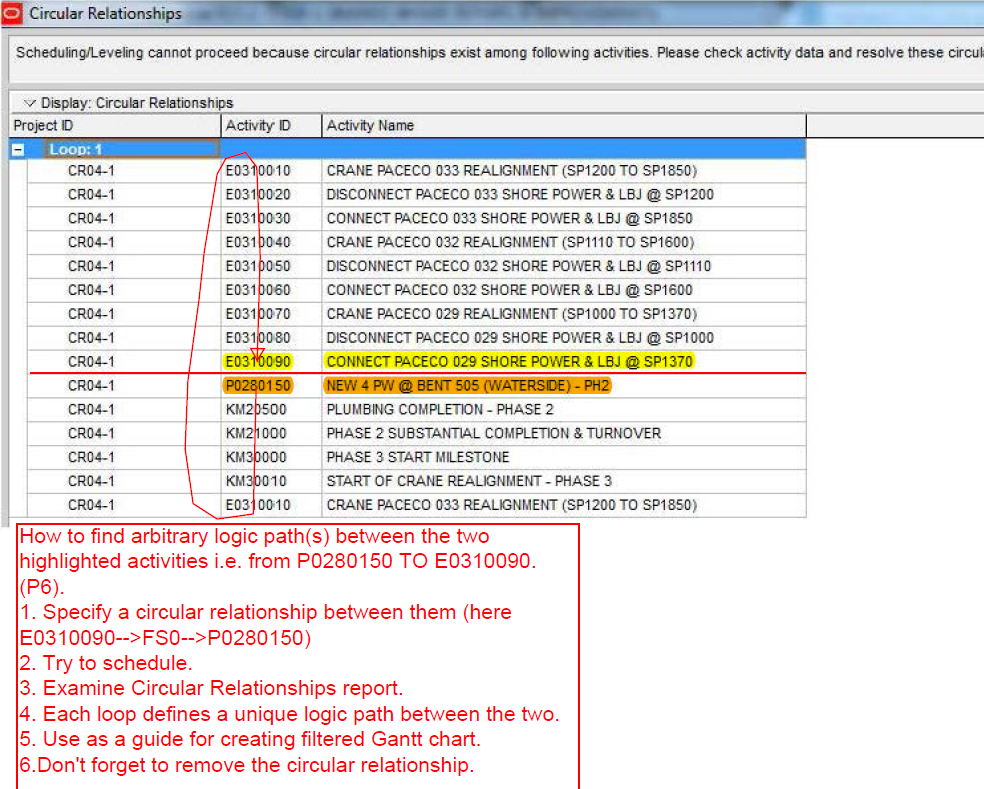
Within the last few days I participated in a LinkedIn discussion on how to develop a similar filter in Primavera (i.e. Oracle Primavera P6), and I’m embarrassed to admit that my initial suggestions (to use Multiple Float Path) were completely wrong.  In fact, the quickest way to show the connections between two arbitrary activities is to create a logical loop between them, then try to reschedule the project.  P6’s error handler will list all the connecting tasks.

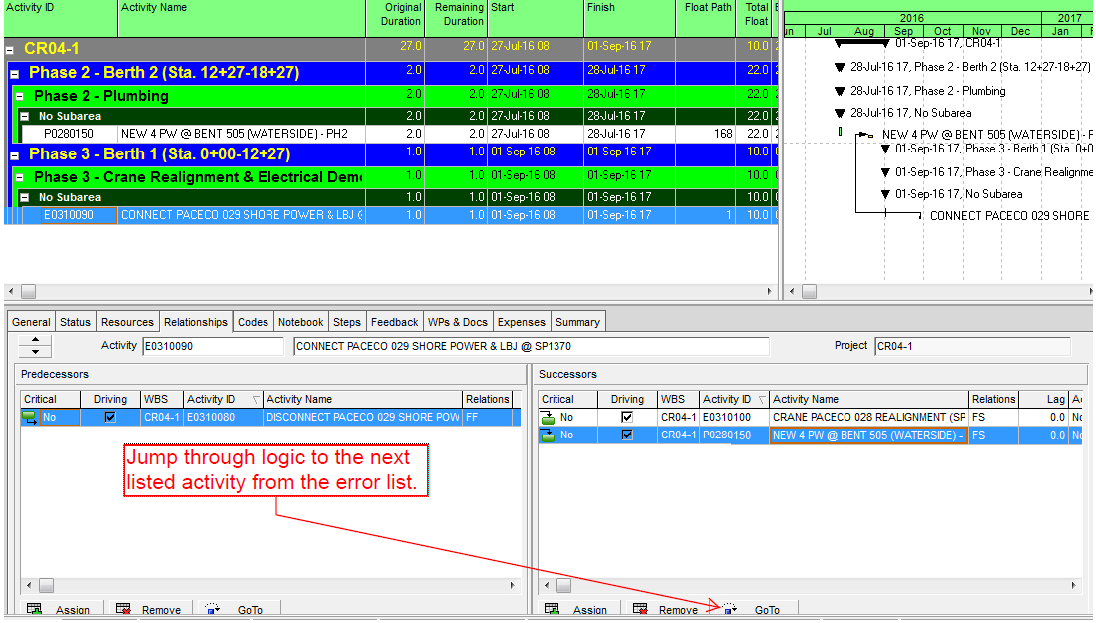
P6 won’t generate the logical filter for you, but the user interface has a very handy feature of being able to add activities to a pre-existing view by simply clicking on the “Goto” buttons in the relationship windows.  The list generated by the loop error will guide your selections.

Here’s an example, taken from a ~2000-activity schedule for an ongoing marine project.  I have selected two activities whose relationship is not obvious, but which are indeed related.

Figure 1: Filter for 2 Arbitrary Connected Activities

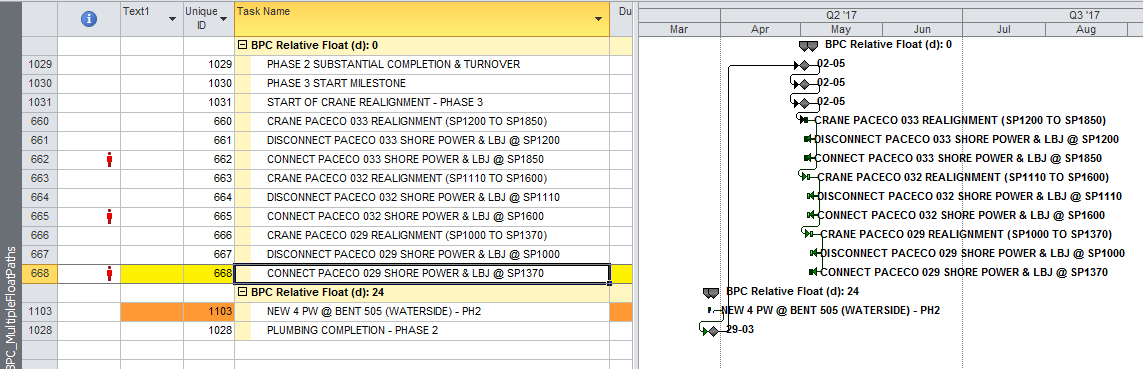
(Using Multiple Float Path analysis of the electrical activity “Connect Paceco…,” I found the plumbing activity “New 4 PW….” activity on float path 168.  I didn’t count the activities in float paths 2 through 167, but we need to exclude most of them without examination.  MFP is clearly not the answer.)

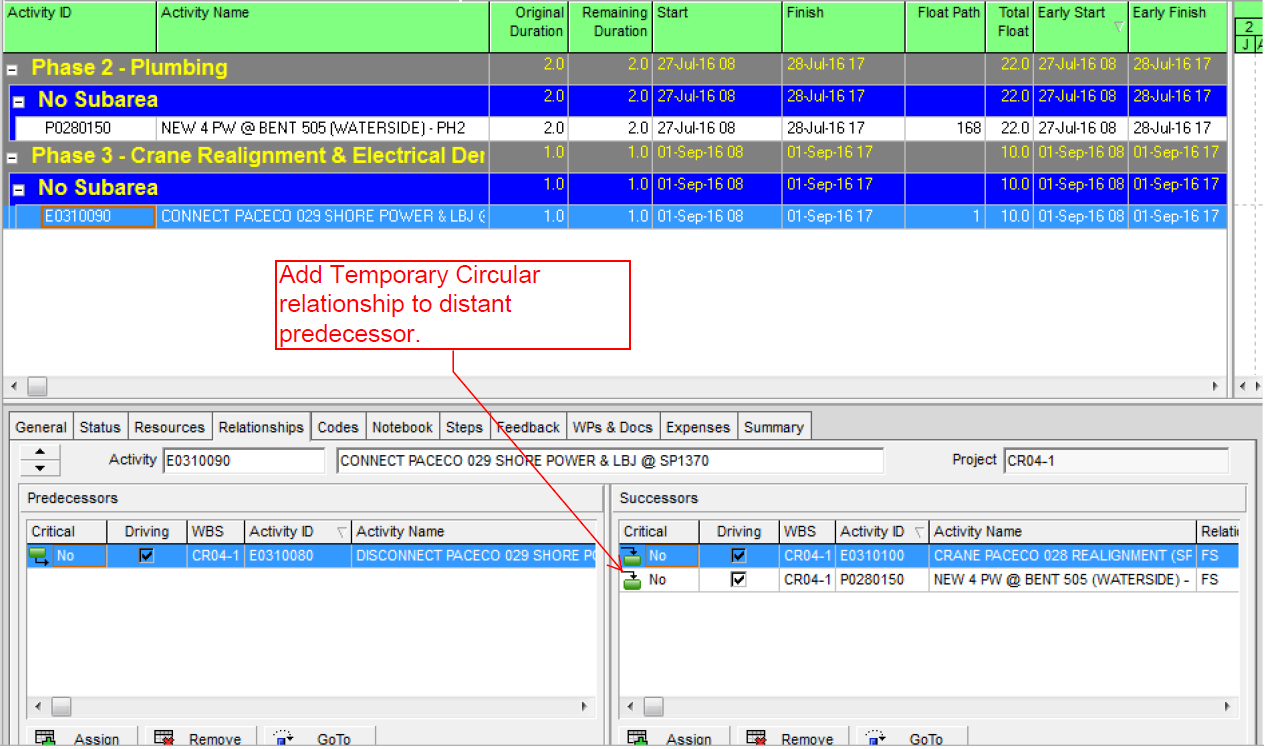
As shown on Figure 1, I first add a circular successor relationship from the later activity, “Connect Paceco…” to its distant predecessor, “New 4 PW….)  Then I try to re-schedule the project.  If no error is generated, the two tasks are not related, or the predecessor/successor direction of the connections may be the opposite of what you expect.  Figure 2 shows the expected error message, with the listing of the looping paths.

Figure 2: P6 Circular Logic Message
Figure 2: P6 Circular Logic Message (with my cheats)

Now use the list as a guide to attach the connected activities to the existing view.

Figure 3: Jumping Through Logic

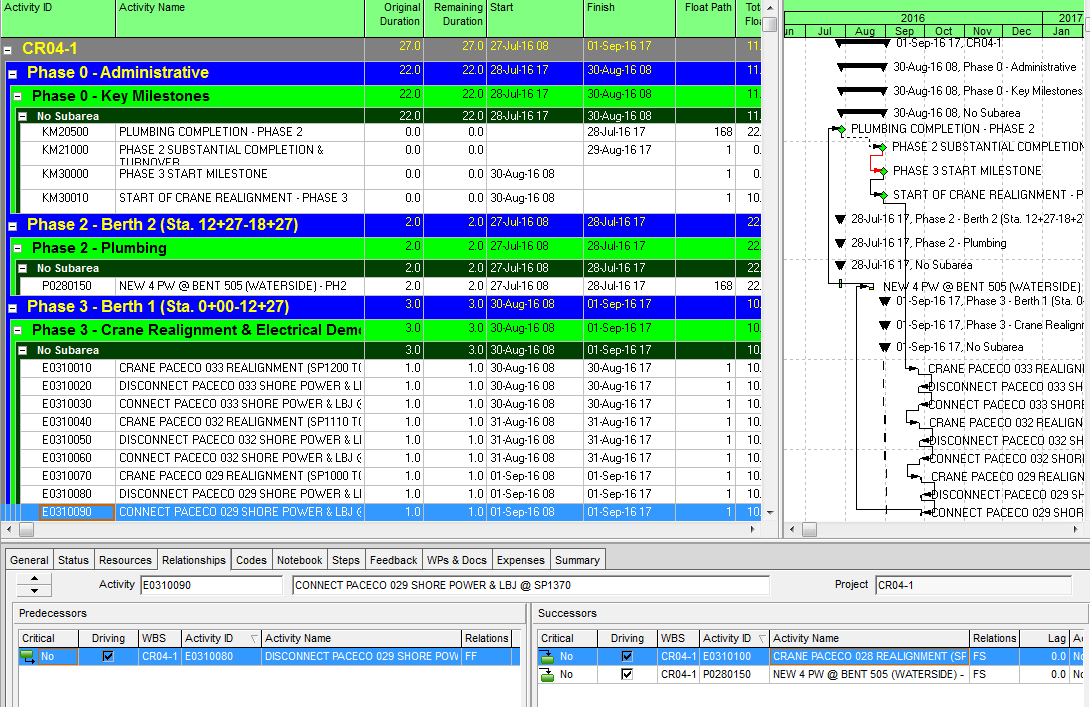
The result after completing the loop:

Figure 4: Manually Constructed Filter of Path Connecting 2 Arbitrary Activities

You might be tempted to make this into a permanent filter by assigning some custom coding to the visible activities and then making the corresponding filter specification.  That doesn’t seem to be worth the extra time to me unless I know for sure that I will be using this filter again.  A pdf or screen shot may be all I need.

Many thanks to Khuong Do for raising this question in the Primavera group on LinkedIn.  In addition, while the method of manually constructing logical filters by jumping through relationships has been around for many years, I thank Zoltan Palffy and Gail Adams for reminding me that it is still there in P6.  Using the circular logic report is something I would never have thought of on my own.  All credit to Mr. Gerry Smith in the Primavera LinkedIn group for that stroke of genius.

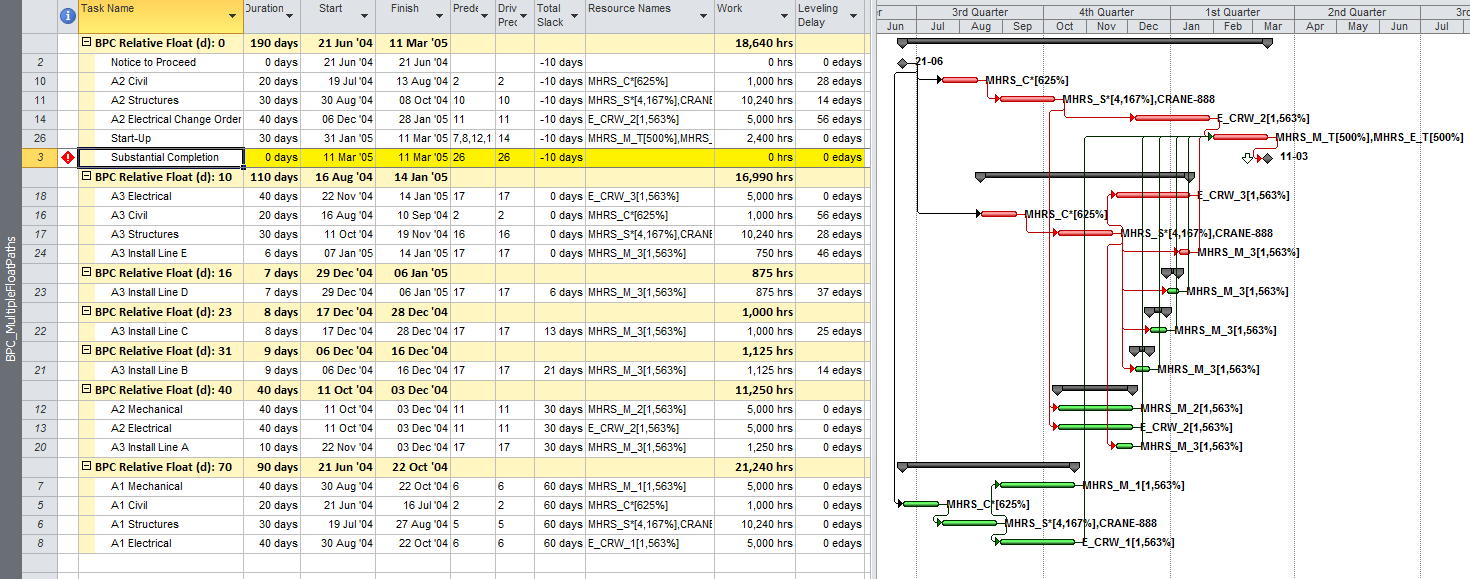
Just for comparison, I used a laborious process to export this project from P6 to Microsoft Project so that I could run the similar report from BPC Logic Filter.  Here’s the result.  Yellow and Orange highlighters identify the “Selected” and “Target” tasks respectively.  (The P6-to-MSP export/import process is crude: Activity IDs were lost.  Calendars were lost, so dates were corrupted.  Logic came through with no problems, however.)

Figure 5: Target Task Output from BPC Logic Filter


Simple Macro for Computing (Duration) Drag in MS Project

Here is the BFDDrag macro, which implements a brute-force technique to compute Critical Path Drag for all tasks in the active project.

Drag and Drag cost are two useful metrics in CPM scheduling that Stephen Devaux introduced in his book Total Project Control, but they are not widely computed or used.  Drag – coined as “Devaux’s Removed Activity Guage,” represents the individual contribution of any single schedule element (e.g. a task) to the overall duration of a project.  By definition, only “Critical Path” tasks have it, and a task’s Drag indicates the total theoretical project acceleration that could be gained if the task’s remaining duration were reduced to zero.  (Duration is not the only contributor to Drag – consider predecessor lags and constraints – but it is certainly the most prevalent.)

Drag can be useful in prioritizing activities for crashing (i.e. shortening) a project schedule.  Consider the simple project illustrated in Figure 1.  The “Critical Path” (ACFIJ – dark-red bars) is partially flanked by a near-critical path (BEH – hatched red bars) with a relative float (same as total slack here) of 2 days.  The overall project duration can be shortened by accelerating critical-path tasks, and most experienced schedulers would be tempted to first consider modifying the two longest critical tasks (C and I).  Accelerating either of them by more than two days yields no benefit, however, as the near-critical path then becomes Critical.  Drag indicates this limit for each task – not so obvious in complex project schedules – in advance.

Figure 1: NLD59DRAG1
Figure 1: Simple Drag Example

Below is a simple, brute force, macro for computing task drag (i.e. the drag of it’s duration) in Microsoft Project. The procedure cycles through each task in the project. If the task is a non-summary, incomplete task that is marked “Critical”, then the procedure sets its remaining duration to zero and measures the resulting acceleration (if any) of the project finish date. That value is stored in the Custom Field – “Duration5” as DRAG.  You’ll have to change this in the macro if “Duration5” is already in use.  I’ve also included a few comments in the code to guide you in modifying its scope.  The procedure is logged in the “Immediate” window of the Visual Basic editor.  After running this macro, Drag Cost could be separately computed for each task using a custom field formula that references the value in “Duration5”.

As noted, this is a “Brute Force” approach that relies on repetitive re-calculation of the CPM network by MSP’s scheduling engine.  At two calculation cycles for each critical task, it may take a long time to chug through a very large project, but it will get there eventually.  If your schedule has negative Total Slack, then MSP may interrupt the procedure to pop up a schedule warning window that you will need to click through (I have not added code to turn this warning off, but you can if you want).  This warning window may not always be visible if MSP is not the active application – you’ll need to click on it occasionally.


Sub BFDDrag()

'       Coded by Thomas Boyle, PE, PMP, PSP on 8Jan'16
'       This is a simple brute-force procedure to compute Duration DRAG (Devaux's Removed Activity Guage") for
'       each Critical task in the active project.  The procedure cycles through each task in the project.  If the task
'       is a non-summary, incomplete task that is marked "Critical", then the procedure sets its duration to zero and
'       measures the resulting acceleration (if any) of the project finish date.  That value is stored in the Custom
'       Field - "Duration5" as DRAG.  The procedure is logged in the "Immediate" window of the Visual Basic editor.

    Dim Tsk As Task, ODur As Double, OFin As Date, TDrag As Double
    Dim StartNote As String
    Dim Counter As Long
        
    Application.CalculateProject
    StartNote = ActiveProject.Name & vbCrLf & Now() & " Starting Drag Brute Force" & vbCrLf
    Counter = 0
        Debug.Print StartNote
    'OFin is the finish date to be tested.  Default is the Project Finish.
    OFin = ActiveProject.ProjectFinish
    
    'Default computes DRAG for each task in ActiveProject.  To compute only for selected tasks,
    'then change "ActiveProject.Tasks" to "ActiveSelection.Tasks"
    For Each Tsk In ActiveProject.Tasks
        If Not Tsk Is Nothing Then
            If Tsk.Summary = False And Tsk.PercentComplete <> 100 Then
                Tsk.Duration5 = 0
                Counter = Counter + 1
                Debug.Print Counter & "Checking Task: " & Tsk.ID & " " & Tsk.Name
                
                If Tsk.Critical = True Then
                    If Tsk.Duration > 0 Then
                        ' Remove Task Duration and Check Finish Date
                        ODur = Tsk.Duration
                        Tsk.Duration = Tsk.ActualDuration
                        Application.CalculateProject
                        If Application.DateDifference(ActiveProject.ProjectFinish, OFin) > 0 Then  'Decreasing Normal Critical case
                            TDrag = Application.DateDifference(ActiveProject.ProjectFinish, OFin)
                        Else    'Decreasing Neutral or Reverse Critical case (Zero Drag)
                            'Test for Increasing Reverse Critical Case
                            Tsk.Duration = ODur + 1 'Adding one minute to Duration
                            Application.CalculateProject
                            If Application.DateDifference(ActiveProject.ProjectFinish, OFin) > 0 Then
                                'Increasing Reverse Critical case
                                TDrag = -1 * 5 'INDICATOR ONLY. Need further testing to find limit
                            Else
                                TDrag = 0
                            End If
                        End If
                        Debug.Print "Drag = " & TDrag / 60 / ActiveProject.HoursPerDay & "Days"
                        Tsk.Duration5 = TDrag
                        Tsk.Duration = ODur
                        Application.CalculateProject
                    End If 'Positive Duration

                Else
                    Debug.Print "Non-Critical"
                End If 'Critical Task Check DRAG
            End If 'Summary=No
        End If 'Not Nothing
    Next Tsk
    
    Debug.Print "Previous: " & StartNote
    Debug.Print Now(), "Finished Drag Brute Force"

End Sub

I started to include Lag Drag in the procedure, but modifying the lag value through code is a little more complicated.  That will have to wait for another time.

I originally wrote a version of this brute-force macro to test the performance of the drag computations in BPC Logic Filter.  Unfortunately, although BPC Logic Filter runs much, much faster for larger networks, it can fail to catch the Drag limitations caused by early start constraints and task calendar changes away from a given task.  This simple macro is still the standard (for incomplete tasks).

[20Jan’16 – Edited code to catch “negative” drag for “reverse-critical” tasks.  These are rare critical-path tasks that include a reverse flow of driving logic.

22Jan’16 – Further code edit to zero-out negative drag for all except the singular case where increasing task duration shorten’s the project.  In that case, the code leaves a value of -0.01 days as an indicator only.]

[This macro computes Drag only with respect to the overall completion of the active project, not any specific completion milestone, and it uses the active project’s default calendar for quantifying Drag.  If your true Critical Path is defined by some completion milestone that is not the last task in the project, then you will need a more powerful tool.  This video demonstrates Drag calculation in BPC Logic Filter.]


Resource Leveling Breaks the “Critical Path” – Logic Analysis of Resource-Leveled Schedules (MS Project)

[31Mar’16: The latest release of BPC Logic Filter now includes resource leveling constraints in the logical path analysis.  I’ve written another article to summarize and amend this one:  The Resource Critical Path – Logic Analysis of Resource-Leveled Schedules (MS Project), Part 2 .]

Effective management of resources – i.e. planning, procuring, mobilizing, and deploying – is a core competency for successful companies in project-focused industries like construction.  Most scheduling tools based on the Critical Path Method (CPM) – like Microsoft Project – can generate project schedules without resources, but they also include methods for assigning, analyzing, and “leveling” project resources.  In this context, “leveling” means selectively delaying some work (compared to the CPM-based schedule) pending the completion of other, more urgent works that demand the same resources.

This simple description might imply that a certain logical/sequential relationship is imposed between two competing tasks (i.e. the “less urgent” work can only start after the “more urgent” work is finished with the resources) – sometimes called “soft logic”.  Unfortunately, the leveling engine in Project 2010 does not appear to use, much less preserve, any such soft logic.  Consequently, logical analysis of the leveled schedule – including interpretation of Total Slack to determine critical path or driving logical path – appears invalid.

Figure 1: Simple Construction Project with Resource Loading

Figure 1 is a simplified CPM model of a construction project involving multiple trades working in multiple areas.  The model includes realistic resource loading, but the logical links have been limited to “hard logic” only (i.e. physical constraints).  In other words, there is no preferential logic to guide the resource deployments.  The default 5dx8h weekly calendar is universally applied, and a deadline of 25Feb’04 has been imposed.  The unleveled CPM schedule includes a forecast completion that is nearly 3 months ahead of the deadline, but resources are severely over-allocated – the schedule appears unrealistic and needs to be leveled.

Specifically:

  1. Three civil works tasks are running concurrently, but there is only sufficient manpower to run them sequentially. (Figure 2.)
  2. Three structural tasks are also running concurrently, and these require both manpower (Figure 3) and a crane (Figure 4), which is the limiting resource. They must be done sequentially.
  3. There is room to install the five separate processing lines concurrently in Area 3, but there is only enough skilled manpower to install them one at a time. (Figure 5).
  4. An electrical change order has been approved in Area 2, but this requires the same specialized crew that is already working there. The Change-order work must be delayed (Figure 6).
Figure 2: Over-Allocation of Civil Works Manpower
Figure 3: Over-Allocation of Structural Erection Manpower
Figure 4: Over-Allocation of Crane
Figure 4: Over-Allocation of Crane for Structural Erection
Figure 5: Over-Allocation of Mechanical Installation Manpower
Figure 5: Over-Allocation of Area 3 Specialized Mechanical Installation Manpower
Figure 6: Over-Allocation of Specialized Electrical Manpower
Figure 6: Over-Allocation of Area 2 Specialized Electrical Manpower

It is a simple matter to remove the over-allocations by manually executing Project’s leveling engine using near-default conditions (Figure 7).

Figure 7: Resource Leveling Options

The leveling engine resolves the over-allocations by selectively delaying those tasks (and task resource assignments, if specified) which are judged to be lower-priority according to Project’s proprietary rules.  Figure 8 illustrates the results of the leveling exercise:

Figure 8: Resource-Leveled Schedule
  1. The primary artifact of the leveling process is the “leveling delay” task property, which is in units of elapsed-duration (i.e. “edays”). The leveling delay is incorporated into the forward-pass schedule calculation, pushing the early start dates of the affected tasks.  (Separate leveling delays can also be applied to resource assignments, which can extend task durations.  This has not been done here and is generally not recommended when assigned resources are expected to work concurrently – e.g. Crane and structural erection crew.)  Leveling delay is also incorporated into the backward pass, removing “phantom slack” from logically-connected tasks.
  2. Through the task leveling delay, the civil, structural, mechanical, and electrical tasks have been re-scheduled sequentially.
  3. Substantial Completion has been delayed until two weeks after the deadline, resulting in 10 days of negative slack on the milestone and its logical driving predecessors.
  4. There is not an obvious (-10d) total-slack path from beginning to end of the project.

Figure 9 illustrates the use of BPC Logic Filter to determine the driving path logic of the Substantial Completion task after leveling.  The driving path is comprised of four tasks and two milestones separated by gaps, and the intervals of the gaps are determined by the “leveling delay.”  Unfortunately, this does not describe a “resource constrained critical path.”  In fact, the obviously critical tasks without leveling delay – including the first (i.e. “A1”) Civil and Structural works and the A2 Electrical works – now have high values of total slack and are shown far from the critical path.  Consequently, it is clear that logical path analysis – including any evaluation of Total Slack – is not consistent with the rule-based resource leveling algorithm used by Microsoft Project.

Figure 9: Logic Analysis of Leveled Schedule

Figure 10 illustrates the un-leveled schedule, revised to include obvious preferential logic for avoiding resource conflicts.  The resulting task sequences and schedule dates are identical to those of the leveled schedule seen earlier, but the associated total slack values and “critical” flags are substantially different.  As shown in Figure 11, however, the logic paths are clear and consistent with the real resource constraints of the project.  The “BPC Relative Float (d): 0” group appears to represent the true resource constrained critical path for the project.

Figure 10: Preferential (Soft) Logic in Unleveled Schedule
Figure 11: Logic Analysis of Unleveled Schedule with Preferential Logic

To recap, Microsoft Project’s proprietary resource leveling engine offers a convenient tool for resolving resource conflicts in project schedules, and this functionality seems heavily used and highly valued in some industries.  It does not appear appropriate, however, for use in complex projects where formal logical sequencing of tasks – including identification of Critical Path or Critical Chain – is required. In particular, Project’s “Critical” flag will fail to accurately mark the critical path in a resource-leveled schedule.   Consequently, a project specification that requires both a logic-driven schedule basis and heuristic resource leveling appears contradictory.

[Click here to proceed to the follow-up article:  The Resource-Constrained Critical Path – Logic Analysis of Resource-Leveled Schedules (MS Project), Part 2 .]